Death and decay are winning in Canada's vast managed forest lands. And this victory is unleashing a rising flood of climate pollution. Put simply, our forests are dying and being cut down faster than they can grow back.
In 2018, the flood of CO2 pouring out of them reached record levels, at nearly a quarter billion tonnes of CO2 in a single year. That's more than Canada's once biggest climate pollution source — the oil and gas sector — emitted that year.
Sadly, this isn't a short-term aberration. The long-term trends are relentlessly grim. They show that our forests switched from much-needed CO2 sinks into dangerous CO2 emitters more than a decade ago. And what started as a trickle has grown into a flood of CO2 pouring into our atmosphere.
That's all according to the latest forest carbon data in Canada's recently released National Inventory Report (NIR). To illustrate the speed and scale of this unfolding crisis — and the role logging is playing in it — I've created a series of charts from this latest data.
The great CO2 flood of 2018
Canada's managed forests are enormous. They span the continent from the Pacific coast to the Atlantic Ocean, and cover an area larger than Germany, France, Spain, Italy and the United Kingdom combined.

As all these billions of trees grow, they breathe in CO2 and strip off the carbon to construct new wood. When the wood rots or get burned, that carbon gets reoxidized into CO2 again.
If there is more growth than decay, the forests are net CO2 absorbers ("carbon sinks"). If decay wins out, the forests emit CO2 ("carbon sources").
Canada reports this net CO2 balance each year in the NIR. That's the line on this first chart.
As you can see, our huge managed forests used to be huge CO2 sinks. During the 1990s, they were able to absorb and store hundreds of millions of tonnes of CO2.
But the data shows that this crucial carbon sink has disappeared. Instead, our forests transitioned to being net CO2 emitters more than a decade ago. And in 2018, they emitted a record 240 MtCO2. That's more than any other sector in Canada. In fact, our managed forests were the largest emitters of greenhouse gases in Canada for three of the last four years in the NIR data.
What's causing such a dangerous surge in emissions? And what role is logging playing in it? To answer these questions, we need to dig a little deeper into the data.
"Death and decay are winning in Canada's vast managed forest lands. And this victory is unleashing a rising flood of climate pollution."
A tale in two parts
Canada reports forest carbon in two parts:
- Net CO2 from forest growth versus decay
- Additional CO2 emitted by harvested wood
My next chart shows both.
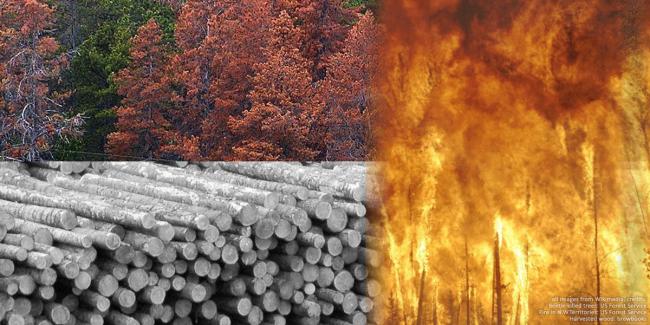
The first part is shown by the bottom black line. This is the annual CO2 balance between growth versus all forms of decay except from harvested wood. Major decay sources include wildfires, insect kills, droughts, and some logging impacts, such as slash burning and exposed soils.

As you can see, these forces of decay have been gaining ground for decades. And the data shows that in extreme years now, death and decay are winning outright, tipping the forests into net emitters.
And that's before we add on Part 2 — the additional CO2 emitted by harvested wood (the yellow area).
Harvested wood CO2 is often a source of confusion. All harvested wood will turn to CO2 eventually. But not all of it does so in the same year it was logged. International climate rules require countries count it all. But there are options for when to count it.
Canada used to count it all in the year the wood was cut. As a result, the harvested wood CO2 numbers listed in older NIRs indicated how much wood got logged that year. This showed the amount of future CO2 locked in by that year's harvest.
A couple years ago, Canada switched to reporting wood CO2 in the year it got emitted back into the air. That's a smaller number, because about a quarter of the wood is in long-lasting products, such as building materials, that haven't rotted yet. Overall, this change retroactively shifted 2,500 MtCO2 from Canada's current and past books onto the future books for Canadians to deal with later.
All charts in this article show this new official "when emitted" number. (Readers wanting more details on this change and its generational burden-shifting can find them in my recent forest carbon explainer.)
The chart above now lets you see the role of harvested wood versus everything else. For example, the 2018 record was the result of all other forms of decay emitting 110 MtCO2 more than new growth absorbed — plus the additional 130 MtCO2 emitted by the burning and decay of harvested wood products.
What this chart also shows is how large the swings in the data can be from year to year. For example, a big wildfire year can create a short-term spike. When confronted with data this "noisy," scientists and policymakers rely on long-term averages to better see and understand the underlying trends.
Visualizing the long-term trends
My next chart shows these underlying trends.
In this chart, I've faded out the annual lines and charted their 10-year running averages on top. Each point on these trend lines shows the average over the 10 years leading up to it.

As you can see, the transition of our forests into super-emitters isn't a short-term aberration. It's a long-term trend that has marched consistently upwards over decades.
The lower black trend line shows that back in the 1990s, the forests were healthy enough to absorb an average of 175 MtCO2 more each year in new growth than they lost to all forms of decay — except from harvested wood.
But now this forest sink trend line has hit zero — the tipping point. That means the net CO2 balance over the last 10 years has been zero. The vital carbon sink at the heart of our enormous forests has vanished.
As I explained in more detail in my recent forest carbon explainer article, the primary driver of this dangerous trend has been increasing droughts, wildfire and insect outbreaks — combined with poor land use actions. Humans have been turbo-charging these trends via our fossil-fuelled climate disruption. And the best science says that droughts, wildfires and insect kills are all expected to grow worse in Canadian forests until climate change is brought under control.
And once again, sitting on top of this black line is the additional CO2 emitted by harvested wood (yellow area). This amount has stayed fairly consistent over the decades, with the 10-year average ranging between 127 MtCO2 and 140 MtCO2 in emissions per year.
That's a huge amount of CO2 for any sector to be emitting.
But, in the past, our forests were healthy enough to grow back as much wood as we cut out of them, and more. That meant the harvested wood was considered "carbon neutral."
Unfortunately for our logging industry — and our future climate safety — our faltering forests can't provide that essential service anymore.
Logging more than grows back

As these trend lines make clear, our logging levels started to exceed what our faltering forests could regrow ("offset") back in the early 2000s.
I've highlighted in red the amount of harvested wood CO2 that exceeded what the forests could absorb.
All that excess CO2 has been accumulating in our atmosphere, fuelling the climate breakdown. Just like the CO2 from our fossil fuel burning.
What started as a trickle has grown into a flood of CO2.
The total so far — the entire red area — exceeds one and a half billion tonnes of CO2. And the 10-year average is now up to 125 MtCO2 emitter per year. That's also a record set in 2018.
To put these emission numbers into context, let's compare them to the emissions from the rest of Canada's economy.
Rocketing past other sectors

The grey lines on this next chart show the annual emissions from all the other Canadian sectors.
The brown line is the same 10-year running average for forest CO2 we discussed above.
It looks steeper on this chart because I've stretched the Y axis a bit to allow you to visually separate the other sector lines.
Emissions from our managed forests have already rocketed past most other sectors.
Their long-term average is now twice as much as what Canada's entire electricity sector emits.
And individual extreme years — like the record 240 MtCO2 emitted in 2018 — are literally off this chart.
Canada's total — accounting versus atmosphere
As a final comparison, let's look at how rising CO2 from our managed forests impacts Canada's total emissions.

The black line on this chart shows Canada's official climate pollution total. It includes all sectors except the land use sector (which contains managed forests).
The falling green arrow is the path to Canada's climate target under the Paris Agreement.
And the rising brown line shows Canada's total emissions when our managed forest CO2 is included. This line shows how much is actually ending up in our atmosphere, fuelling the climate crisis.
And — critically — we are in control of all the emissions on this chart.
That includes the entire red area showing managed forest CO2. We could reduce this back down to zero by limiting our logging to what our forests can reabsorb each year. If we want to continue logging at current high levels, we will need to restore the carbon sink in our forests or find another way to offset the huge emissions of CO2 from our harvested wood. But we need to do those things anyway to achieve "net zero" in all other sectors of economy.
The climate science is clear that the path to a safe and sane climate future requires us to eliminate all sources of excess CO2, regardless of origin.
So far, however, Ottawa has responded to this emerging CO2 threat by trying to push this rising new flood of CO2 off the books. To do this, they've had to roll out a series of big and controversial changes in how they account for forest carbon.
But the atmosphere and the laws of physics don't care what kinds of creative accounting we try. They only react to the total amount of CO2 accumulating in the air. And in Canada, total emissions of CO2 are not going down as promised and as required for a safe future.
They aren't even flatlining-to-failure as our official numbers say.
They are rising dangerously fast.
We control it all. We need to start lowering our rising flood of climate pollution while we still can.