Articles Menu
Decades of failing to cut emissions are saddling Canadians with ever-steeper climate targets.
By dragging our feet, we've increased the amount of emissions we need to cut while shrinking the time we have remaining to do it. As the world races to net-zero in 2050, the penalty Canadians are paying for foot-dragging is piling up fast.
To illustrate the increasingly deep hole we've dug for ourselves, I've created two charts. With the first, we'll look at Canada's history of ever-rising emissions and the ever-steepening climate targets that have come with it. And with the second chart, we'll compare the diverging paths to net-zero taken by Canada and one of our Commonwealth peers, the United Kingdom. We used to be side-by-side with them. As you'll see, the U.K. steadily cut emissions while we let ours rise. The U.K.'s actions are paying big dividends for them now, while our inaction is making our path ahead increasingly difficult.
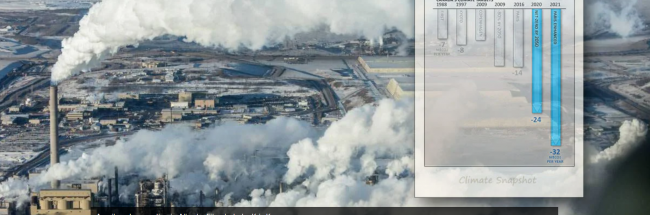
This first chart shows how Canada's climate targets keep getting steeper. Each target is represented by a downward bar. These bars show how many millions of tonnes of CO2 (MtCO2) needed to be cut every year if we were to meet that target. The year shown above each bar is the year in which each target was pledged.

For example, Canada's first target was set in 1988 and required cuts of 7 MtCO2 each year.
Back then, Canada emitted around 600 MtCO2 a year. You can see how much Canada was emitting as each target was pledged by looking at the dotted line at the top of the chart.
Notice how every time Canada needed to pledge a new climate target, we were emitting more than when we set the previous target.
Unsurprisingly, increasing the pile of emissions while shrinking the time to act leads to steeper targets.
A good example of this can be seen in the targets set by the Harper government. Back in 2009, it set a Copenhagen Accord target that required cuts of 7 MtCO2 each year. Instead of cutting emissions that much each year, Canada increased them. Several years later when the Harper government needed to propose a new target under the Paris Agreement, it had to double the rate — to 14 MtCO2 each year.
Again, Canada didn't follow through and instead let climate pollution rise to 730 MtCO2 in 2019 (the most recent year of data available).
The Trudeau government recently joined our global peers in pledging to hit net-zero by 2050. We now need to cut 24 MtCO2 each year to get there. As we will see next, these are much larger cuts each year than we would be facing if we had not dragged our feet for so long.
This second chart shows this clearly in the diverging paths taken by the U.K. and Canada.
Decades of rising emissions are saddling Canadians with ever-steeper climate targets. And columnist @bsaxifrage has the receipts. - Twitter

I've chosen the U.K. for comparison because back in 2002, both nations emitted the same amount — around 705 MtCO2. That's shown by the red dot in the upper left of the chart.
Back then, both nations had the same pathway to net-zero emissions in 2050 — cutting emissions 15 MtCO2 per year.
As the blue line shows, the U.K. followed that path. It enacted strong climate policies that steadily cut its emissions in line with what was needed. Now it only needs to continue on at the same pace.
As the red line shows, Canada did the opposite by increasing emissions. That's forced our path to net-zero in 2050 to become steeper and steeper.
For example, by 2010, the cuts we needed to make had grown 20 per cent to reach 18 MtCO2 per year.
By 2015, they were 40 per cent larger, at 21 MtCO2 per year.
By 2019, they were 60 per cent larger, at 24 MtCO2 per year.
And if our emissions are just as high in 2025, our required cuts will rise again to hit 28 MtCO2 per year. That's twice as much each year than if we had stayed in step with the U.K.
The U.K. has gained two big dividends by steadily cutting its climate pollution. The first payoff, as shown above, is that its remaining cuts are now much smaller than ours each year. The second bonus is that it already has a tested set of policies in place delivering the kinds of cuts needed. As the chart shows, the U.K. has a straight-line path to 2050. Keep calm, carry on.
Compare the U.K.'s path to what Canada now faces. We need to dramatically change direction, and quickly. Our existing hodgepodge of weak policies has plunged us into ever-deeper trouble. Now we face the double burden of having to make much larger cuts each year, while also developing a new set of climate policies and expertise that will allow us to do that.
Hey, here's a crazy idea. How about the Canadian government immediately adopts the policies that have worked so well for the U.K.? Right now. This year.
We could start by adopting its powerful Carbon Budget Law. It empowers an independent commission to develop all the needed policies to meet the targets. The government is required by law to stay on the path to net-zero by 2050 by meeting carbon budgets that cover all emissions in every year, starting immediately with the year it is enacted. And the government must enact all the policies to meet each carbon budget many years in advance to give citizens and businesses a long lead time to transition.
The U.K. passed this law way back in 2008. We'd certainly be late to the party, but at least we'd have something to celebrate in Canada, for a change.
As the chart above clearly illustrates, our decades of foot-dragging come with real costs to Canadians. These costs are piling up rapidly. If we had joined the U.K. on climate action back in 2002, Canadians would have a much easier task today. The longer we delay in enacting effective climate policies, the harder it will be for us.
*******
Endnotes:
PER CAPITA EMISSIONS
The U.K. has a larger economy and bigger population than Canada. So even when our national emissions were the same back in 2002, the British emitted half as much per capita as we were. Despite having much lower emissions per person, they still managed to make big cuts to their overall emissions. At this point, the British emit only one-third as much per capita as Canadians: 7 tonnes of CO2 (tCO2) vs 20 tCO2 for us.
FOOT-DRAGGING AND THE PARIS TARGETS
Canada's penalty for foot-dragging also shows up in our Paris Agreement targets. The discussion of this is a bit longer and more detailed, so I've put it here in the endnotes for those interested.
I've also added an extra chart to help illustrate it. This chart shows the emission history since 1990 for the Group of Seven (G7) nations, which includes the European Union (EU) as well.

Initial targets for 2030 are shown on the chart as grey bull's eyes with grey text. Canada's initial target was proposed by the Harper government and later formally submitted by the Trudeau government. It worked out to 15 per cent below 1990 levels by 2030. As you can see, that matched the targets from the U.S. and Japan at the time. To meet this initial target, Canada needed to cut 14 MtCO2 each year starting in the pledge year.
Those initial targets were too weak to stave off a full-blown climate crisis. So, last year, all the G7 nations enhanced their targets. These new targets are shown in purple on the chart.
Canada's new target worked out to 26 per cent below 1990 levels. To get there, we now need to cut an eye-watering 32 MtCO2 each year. That's obviously far more than the 14 MtCO2 per year required when we set our first target.
Notice, however, that our new target is now far behind the targets set by the U.S., Japan and all the others. That's because all the other G7 nations reduced their emissions over the last decade, while ours went up. Their progress has left them with less remaining to do. Our foot-dragging has squandered yet another decade and ratcheted up our task ahead even more.
[Top photo: An oilsands operation in Alberta. File photo by Kris Krug]