Articles Menu
The quantity of greenhouse gases (GHGs) generated by our food can vary considerably across the global food supply chain.
In fact, the difference between specific food types can vary by orders of magnitude, meaning what we eat could be a significant factor impacting GHG emissions on the environment.
Today’s modified chart from Our World in Data relies on data from the largest meta-analysis of food systems in history. The study, published in Science was led by Joseph Poore and Thomas Nemecek to highlight the carbon footprint across different food types across the world.
Worldwide, there are approximately 13.7 billion metric tons of carbon dioxide equivalents (CO2e) emitted through the food supply chain per year.
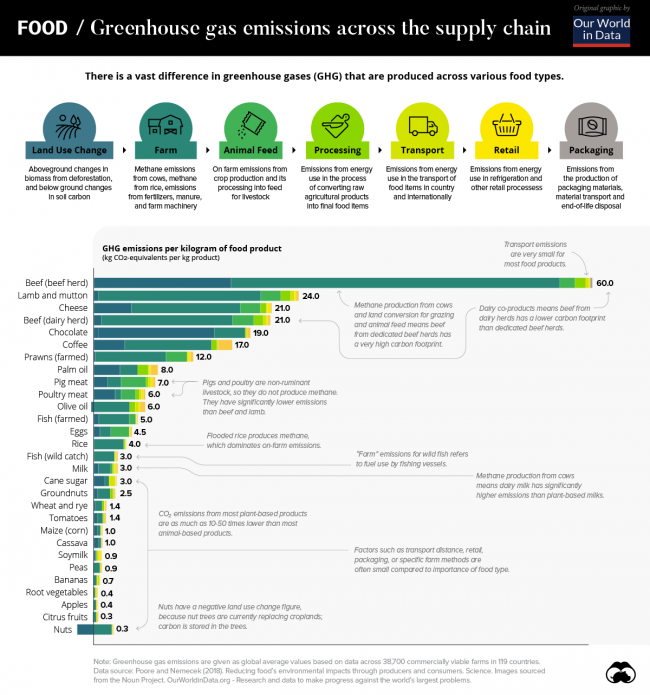
Across a database extending through 119 countries and 38,000 commercial farms, the study found that, unsurprisingly, beef and other animal products have an outsize effect on emissions.
For example, one kilogram (kg) of beef results in 60 kg of GHG emissions—nearly 2.5x the closest food type, lamb and mutton. In contrast, the same weight of apples produce less than one kilogram of GHG emissions.
| Food Type | GHG Emissions per 1 kg Produced |
|---|---|
| Beef (beef herd) | 60 kg |
| Lamb & Mutton | 24 kg |
| Cheese | 21 kg |
| Beef (dairy herd) | 21 kg |
| Chocolate | 19 kg |
| Coffee | 17 kg |
| Prawns (farmed) | 12 kg |
| Palm Oil | 8 kg |
| Pig Meat | 7 kg |
| Poultry Meat | 6 kg |
When it comes to plant-based foods, chocolate is among the highest GHG emitters. One kilogram of chocolate produces 19 kg of GHGs. On average, emissions from plant-based foods are 10 to 50 times lower than animal-based types.
Bottom line, it is clear that the spectrum of emissions differs significantly across each food type.
The food supply chain is complex and nuanced as it moves across each stage of the cycle.
Although the steps behind the supply chain for individual foods can vary considerably, each typically has seven stages:
Across all foods, the land use and farm stages of the supply chain account for 80% of GHG emissions. In beef production, for example, there are three key contributing factors to the carbon footprint at these stages: animal feed, land conversion, and methane production from cows. In the U.S., beef production accounts for 40% of total livestock-related land use domestically.
On the other end of the spectrum is transportation. This stage of the supply chain makes up 10% of total GHG emissions on average. When it comes to beef, the proportion of GHGs that transportation emits is even smaller, at just 0.5% of total emissions.
Contrary to popular belief, sourcing food locally may not help GHG emissions in a very significant way, especially in the case of foods with a large carbon footprint.
Amid a growing market share of plant-based alternatives in markets around the world, the future of the food supply chain could undergo a significant transition.
For investors, this shift is already evident. Beyond Meat, a leading provider of meat substitutes, was one of the best performing stocks of 2019—gaining 202% after its IPO in May 2019.
As rising awareness about the environment becomes more prevalent, is it possible that growing meat consumption could be a thing of the past?
[Top chart: Carbon footprint food supply chain - See original for easier readability.]