Articles Menu
Through two new studies in Nature, the weakening of the Gulf Stream System is back in the scientific headlines. But even before that, interesting new papers have been published – high time for an update on this topic.
Let’s start with tomorrow’s issue of Nature, which besides the two new studies (one of which I was involved in) also includes a News&Views commentary. Everything revolves around the question of whether the Gulf Stream System has already weakened. Climate models predict this will be one consequence of global warming – alongside other problems such as rising sea levels and increasing heat waves, droughts and extreme precipitation. But is such a slowdown already underway today? This question is easier asked than answered. The Atlantic Meridional Overturning Circulation (AMOC, also known as Gulf Stream System) is a huge, three-dimensional flow system throughout the Atlantic, which fluctuates on different time scales. It is therefore by no means enough to put a current meter in the water at one or two points.
Since 2004 there has been a major British-American observation project, called RAPID, which tries to measure the total flow at a particularly suitable latitude (26.5° North) with 226 moored measuring instruments. This provides good results and shows a notable slowdown – but only since 2004, and probably the change over such a short period of time is mainly due to natural fluctuations and in itself hardly reveals anything about the possible effects of climate change.
If you want to look further back in time, you have to look for other sources of evidence. In my view, it is the ocean temperatures that are most likely to solve the mystery – because firstly, there is a lot of good data and, secondly, the AMOC has a dominant influence on sea temperatures in large parts of the North Atlantic. In our study – together with colleagues from Princeton and the University of Madrid – we therefore compare all available measurement data sets since the late 19th century with a simulation of a climate model in which the ocean currents are computed in very high resolution. Here is a cool animation:
This model simulation took six months on 11,000 processors (9,000 of them for the ocean alone) of the high-performance computer at NOAA’s Geophysical Fluid Dynamics Laboratory in Princeton. The central result is shown in Fig. 1 (left).
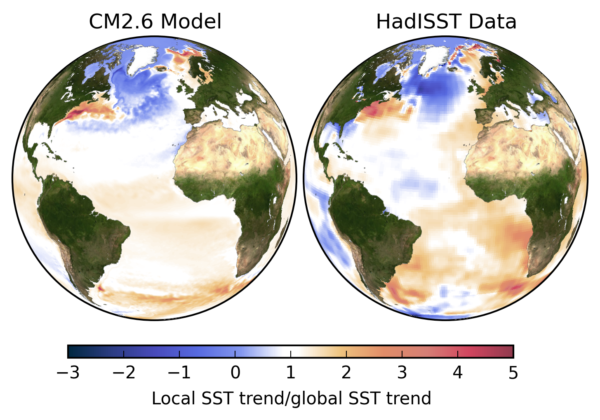
Fig. 1 Trends in sea surface temperatures. Left: in the climate model CM2.6 in a scenario with a doubling of the amount of CO2 in the air. Right: in the observation data from 1870 to the present day. In order to make the trends comparable despite the different periods and CO2 increases, they were divided by the globally averaged warming trend, i.e. all values above 1 show an above-average warming (orange-red), values below 1 a below-average warming, negative values a cooling. Due to the limited availability of ship measurements, the measurement data are much more “blurred” than the high-resolution model data. Graph: Levke Caesar
In the North Atlantic, the measured values differ markedly from the average global warming: the subpolar Atlantic (an area about half the size of the USA, south of Greenland) has hardly warmed up and in some cases even cooled down, contrary to the global warming trend. In contrast, a wide area along the American east coast has warmed up at an excessive rate. Both can be attributed to a weakening of the AMOC in the model simulation. The cooling is simply due to the reduced heat input from the AMOC. The excessive warming, on the other hand, is based on a somewhat more nerdy mechanism that has been known to experts for some time: if the AMOC weakens, the Gulf Stream shifts closer to the coast. (This has to do with conservation of angular momentum on the rotating globe.)
The model thus shows a fairly characteristic “fingerprint” of sea surface temperatures as the AMOC weakens. We now wanted to know what temperature changes the observational data show since the late 19th century. My doctoral student Levke Caesar evaluated the various data sets. They show a very similar pattern – see the right globe in Figure 1 – and the annual cycle of change – more cooling in winter – also corresponds to that of the model simulation. I know of no other mechanism that could explain this spatial and temporal pattern than a weakening of the AMOC. Such a slowdown as a result of our greenhouse gas emissions has long been predicted by climate models – these data show that it is already underway.
Weaker than for over a thousand years
Another new study (Anomalously weak Labrador Sea convection and Atlantic overturning during the past 150 years by David Thornalley and colleagues) was published in the same issue of Nature, which supports this finding and places it in a longer climate history context. The authors used two types of data from cores in sediments at the seabed – so-called ‘proxy data’. These deposits gradually accumulate over thousands of years and tell us what happened in the ocean in the past. Naturally fuzzier than modern observations – but reaching much further back in time, in this case 1600 years.
The first data series – from calcareous shells of marine organisms that live 50 to 200 metres below the sea surface in the northern Atlantic – shows the temperature conditions there. From these, the strength of the heat transport and thus the flow can be deduced, similar as in our study. A second data series is based on the grain size of the sediments at two points at a depth of 1700 and 2000 metres – where part of the water brought northwards by the Gulf Stream flows back towards the south as a cold deep current. The neat thing is that the current sorts the sediment. Coarse grain size of the sediments indicates a strong flow, finer grain size indicates a weaker flow, to put it as a simple rule of thumb.
The authors conclude from their data that the AMOC has never been as weak in all those previous centuries as in the last hundred years. This supports an earlier conclusion of a study I led in 2015, where we had already concluded this for the last 1100 years – based on a completely different, independent database.
A look at the time evolution
What changes in the AMOC do the data show? The time series from the two new and some earlier studies are shown in Fig. 2. Each of the six curves is based on a different data type and methodology, but they show a largely consistent picture. The green curve shows changes in water mass based on deep sea coral data, the blue curve shows the grain sizes mentioned and the yellow curve shows the RAPID measurements discussed above. The three remaining curves are based on temperature changes – but also on three different methods. The curve from Rahmstorf et al. 2015 was based on a network of land-based proxy data such as tree rings and ice cores, while the new red curve from Thornalley et al. was based on sediment data. And the new curve from our study (dark blue) uses measured sea surface temperatures, as shown in Fig. 1.
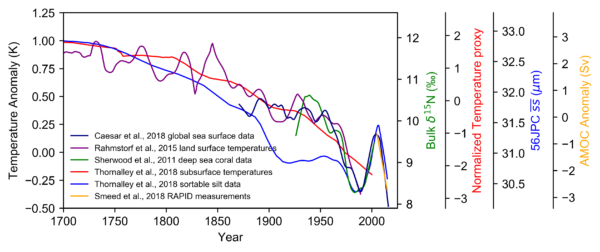
Fig. 2 Time evolution of the Atlantic overturning circulation reconstructed from different data types since 1700. The scales on the left and right indicate the units of the different data types. The blue curve was shifted to the right by 12 years since Thornalley found the best correlation with temperature with this lag. Makes sense: it takes a while until a change in currents alters the temperatures. Graph: Levke Caesar.
The curves all show a long-term slowdown that is accelerating. The red curve is so smooth because these particular sediment data have too low a time resolution to show shorter fluctuations. The blue curve shows an early decrease already in the 19th century, which Thornalley and colleagues attribute to an earlier warming at the end of the so-called ‘Little Ice Age’, when the inflow of meltwater could have slowed the formation of deep water in the Labrador Sea. This is not necessarily a contradiction to the other data series, because the two sediment cores used are located in the area of the deep outflow of Labrador Sea Water – but this is only one of two deep currents that together make up the southward part of the overturning circulation of the Atlantic, and thus the heat transport to the north. Therefore, the time evolution of ocean temperatures does not always have to coincide with that of the Labrador Sea Water.
In our study we conclude that the AMOC has weakened by about 15% since the middle of the 20th century. In absolute figures, this is a weakening of the current by 3 million cubic metres per second – a figure that corresponds to around fifteen times the flow of the Amazon, and thus three times the outflow of all rivers on earth combined. Using a whole suite of climate models (the CMIP5 models), we have tested how well our temperature-based estimate can reflect the actual trend of the AMOC, and have arrived at an uncertainty of plus or minus one million cubic metres per second.
Some other studies
There are a number of other studies worth reporting on the subject, which I can only briefly mention here. Moore et al 2015 found in Nature Climate Change that convection (the deep mixing of seawater closely linked to the AMOC) in the Greenland and Iceland Seas has weakened and is likely to exceed a critical point as global warming continues, where it will become limited in the depth reached. Sevellec et al 2017 argue in the same journal that the weakening of the circulation could be caused mainly by the shrinkage of sea ice in the Arctic. Oltmanns et al (2018, again in Nature Climate Change) recently found signs of a growing risk that convection in the Irminger Sea could shut down. Sgubin et al. (2017, Nature Communications) analyse the occurrence of abrupt cooling in the North Atlantic in various climate models. And finally, Smeed et al. 2018 recently reported in Geophysical Research Letterson the latest measurements in the RAPID project, which are also included as a linear trend in Fig. 2. At the annual gathering of the European Geosciences Union (14,000 geoscientists are meeting in Vienna), which I am currently attending, the changes in the North Atlantic are also an intensively discussed topic.
What effects could the slowdown have?
It sounds paradoxical when one thinks of the shock-freeze scenario of the Hollywood film The Day After Tomorrow: a study by Duchez et al. (2016) shows that cold in the North Atlantic correlates with summer heat in Europe. This is due to the fact that the heat transport in the Atlantic has not yet decreased strongly enough to cause cooling also over the adjacent land areas – but the cold of the sea surface is sufficient to influence the air pressure distribution. It does that in such a way that an influx of warm air from the south into Europe is encouraged. In summer 2015, the subpolar Atlantic was colder than ever since records began in the 19th century – associated with a heat wave in Europe. Haarsma et al (2015) argue on the basis of model calculations that the weakening of the AMOC will be the main cause of changes in the summer circulation of the atmosphere over Europe in the future. Jackson et al (2015) found that the slowdown could lead to increased storm activity in Central Europe. And a number of studies suggest that if the AMOC weakens, sea levels on the US coast will rise more sharply (e.g. Yin et al. 2009). The impacts are currently being further researched, but a further AMOC slowdown cannot be considered good news. Yet, although the oscillations seen in Fig. 2 suggest the AMOC may well swing up again for a while, a long-term further weakening is what we have to expect if we let global warming continue for much longer.
Weblinks
German version of this blog article: Stärkere Belege für ein schwächeres Golfstromsystem
Washington Post: The oceans’ circulation hasn’t been this sluggish in 1,000 years. That’s bad news.
Carbon Brief: Atlantic ‘conveyor belt’ has slowed by 15% since mid-20th century
AP in Spanish: Cambio climático debilita corriente oceánica: estudio
Washington Post: The fast-melting Arctic is already messing with the ocean’s circulation, scientists say (about the Oltmanns paper)