Articles Menu
Jan. 23, 2023
When it comes to our exploding climate crisis, fossil fuels are the undisputed weapons of mass destruction.
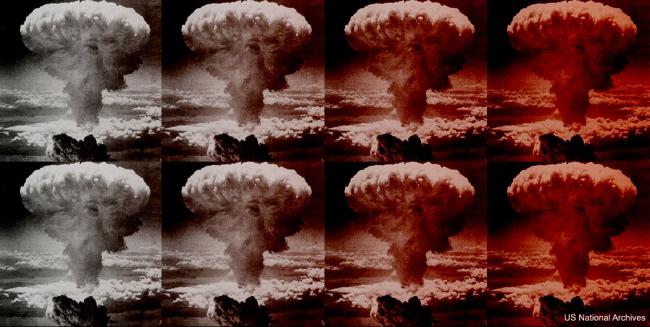
In a 2012 TED Talk that's been viewed more than a million times, climate scientist James Hansen explains the climate impact from burning fossil fuels is the "equivalent of exploding 400,000 Hiroshima atomic bombs per day, 365 days per year. That’s how much extra energy Earth is gaining each day." For energy nerds, the energy in our climate system is rising at the rate of 250 trillion joules per second.
Historically, the responsibility for carbon-bombing our climate has been assigned to the demand for fossil fuels — the people buying and burning them. But after decades of climate failure using this one-sided approach, responsibility is quickly expanding to include the carbon bomb suppliers, as well. These are the people who extract and sell fossil fuels.
To get a sense of Canada’s role as a carbon bomb supplier, and how we compare to peer nations, I dug into the fossil fuel production data from BP’s Statistical Review of World Energy. Here’s what I found.
My first chart shows the amount of climate pollution being dug out of the ground in the form of fossil fuels. This is the carbon dioxide released when the fossil fuel product is burned. In climate parlance, emissions caused by the use of your product are known as Scope 3 emissions. And when your product is fossil fuels, Scope 3 emissions account for 80 per cent of the pollution they cause. (Note: For an overview of Scope 1, 2 and 3 emissions, see the endnotes.)

Canadians are the red line on top. Back in 1990, we extracted fossil fuels containing 24 tonnes of CO2 (tCO2) per Canadian. That was five times the global average. Instead of reducing our carbon bomb production to ensure a safe and sane climate future, we cranked it up. We now dig up 35 tCO2 per Canadian — seven times the current global average. And we aren’t planning to stop there.
For comparison, the world’s five largest economies are shown by the gray lines on the chart:
1. U.S. — The world’s largest economy is synonymous with fossil fuel excess. But even the Americans only dig up half as much climate pollution per person as we do. If Canadians were willing to restrain ourselves to an American level of climate extremism, we’d cut our Scope 3 climate pollution in half.
2. China — The world’s second-largest economy is known for rampant coal extraction. The Chinese now extract 5 tCO2 per capita each year just in coal. When combined with their oil and gas production, they extract a total of 6 tCO2 per person. Canadians dig up six times more climate pollution per person. If we refuse to rein in our super-sized carbon bomb production, why would China — or anyone else — stop at far less?
It turns out Canada really is a climate leader — but sadly, in the wrong direction. @bsaxifrage breaks it down for @NatObserver readers. - Twitter
3. Japan — Japan has few fossil fuel deposits that it can extract. Its only major source is frozen methane hydrates in its deep ocean waters. Fortunately for our climate future, Japan hasn't figured out how to extract them cost-effectively despite decades of trying.
4. Germany — You might be surprised to hear that Germany was the world's third-largest coal producer back in 1990. Since then, they've shut down two-thirds of their coal production. As a result, the amount of climate pollution Germany extracts per person has plunged from 11 tonnes of CO2 per year, down to just three. As Canadians can probably imagine, it isn’t ever easy to rein in your dominant fossil fuel industry. But Germany has cut off most coal subsidies and shut down most of the extraction.
5. U.K. — Coal also used to be a key part of the British economy and national identity. So, it hasn’t been easy for them, either, to reduce the amount of coal they extract. But they’ve now shuttered nearly all of it. In recent decades, oil has been their dominant fossil fuel industry. And they’ve even managed to reduce extraction of that — and cut methane gas extraction, too. Along the way, the British cut their direct fossil fuel emissions in half.
If our Commonwealth peers can reduce their climate damage in all those areas, Canadians certainly could, too. We know how to rein in our climate impacts, we've simply chosen not to.
To provide an even larger context, I’ve expanded my chart to show the world's top 12 economies. Canada is one of them, at No. 9.

Together, these 12 nations generate 70 per cent of the global GDP. If the world is going to prevent a full-blown climate breakdown, these nations will need to lead the way.
As the red line shows, Canadians remain the climate rogues even in this expanded group. It turns out we really are climate leaders — but sadly, in the wrong direction.
Only the Russians dig up and sell anywhere close to as much climate pollution per person as Canadians do.
The remaining major economies — No. 6 India, No. 7 France, No. 8 Italy, No. 10 South Korea and No. 12 Brazil — are all extracting climate pollution at or below the global average per person.
Preventing a full-blown climate crisis requires rapidly decreasing the amount of climate pollution getting pulled out of the ground — all the way to zero. The carbon-bombing laying waste to our formerly stable climate needs to stop.
United Nations Secretary-General António Guterres has been blunt about what needs to happen: nations must “end all new fossil fuel exploration and production” and turn away from “fossil fuels before they destroy our planet.”
I’ll wrap up with a final chart showing the breakdown of Canada’s climate pollution extraction.

Of particular note is the dark red wedge at the bottom. That’s the amount of climate pollution we extract in the form of bitumen (“oilsands”).
Our Scope 3 climate pollution arising from bitumen has surged seven-fold since 1990. It’s now up to 14 tonnes of CO2 per Canadian — and still rising. That alone exceeds all the climate pollution extracted per person in China, Britain, Germany and India — combined.
Amazingly, even such an extreme level of carbon bomb production still isn’t enough for Canada’s federal and provincial governments. They continue to greenlight ever more climate pollution extraction — while pouring billions of taxpayer dollars into super-sizing it even further.
The goal seems to be to ensure that the very last carbon-bombing of Earth’s battered climate will be done with Canadian-made bombs. And while there are profits to be made from producing weapons of mass climate destruction, Canada plans to have its elbows out grabbing as big a slice of the calamity pie for itself as possible.
If Canadians ever want to turn around and head toward climate sanity, we have lots of options for reining in our carbon bomb juggernaut.
For example, we’ve been aligning many of our climate policies and targets with the Americans for decades. We could now align our Scope 3 emissions per capita, as well. As shown above, if we did that, then our Scope 3 emissions would be heading down to net zero — instead of ever upwards as they are now.
We could also adopt successful policies used by our British and German peers who have made deep cuts in their climate pollution extraction. Both nations have reduced carbon extraction in their primary fossil fuel industries.
And we could sign on to the Fossil Fuel Non-Proliferation Treaty. This global treaty aims for a fair and co-ordinated ramp down in the production of weapons of mass climate destruction.
And, of course, Canadian citizens have the ability right now and every day to combine their voices, financial power and votes to drive the needed changes.
As these charts make clear, our comfortable status quo in Canada is leading us away from safety and into an increasingly hostile climate war zone. All those carbon bombs we are making are falling on our own families' future, as well.
-----------------
Endnotes
ABOUT SCOPE 1, SCOPE 2 & SCOPE 3 EMISSIONS
There are three categories used for reporting climate pollution.
Scope 1 covers directly released emissions (from the fossil fuels you burn directly).
Scope 2 covers indirect emissions from other energy you use (the emissions from generating the electricity you use).
Scope 3 covers indirect emissions emitted throughout the "value chain" for your product or service (from your fossil fuel products when burned by your customers).
These three categories are used to divide up the responsibility for the full "value chain" of a product or service. Historically, responsibility has mostly been focused on Scope 1 and Scope 2 emissions. But this method has spectacularly failed to meet global climate goals. As a result, the focus is rapidly expanding to cover the entire "value chain" by including Scope 3 emissions as well.
FOSSIL FUEL DEMAND (SCOPE 1 EMISSIONS)
This article covered the supply side of climate pollution (Scope 3 emissions of fossil fuels). For those interested in the demand side (Scope 1 emissions of fossil fuels), here’s a chart showing these direct fossil fuel emissions per capita in the same nations.

As you can see, Canadians are the biggest fossil fuel guzzlers (Scope 1 climate polluters) in this group, as well. We emit an average of more than 15 tCO2 per person each year from burning fossil fuels.
The Americans used to emit many tonnes more per person than Canadians. But they’ve been reducing their national emissions in recent years while Canada hasn’t. So now the Yanks have passed us up, leaving us dead last among the world's dozen largest economies.
Also worth noting are the British, who have cut their emissions in half since 1990. They are now down to 6 tCO2 per capita, close to the global average.
India did the opposite. They doubled their per capita emissions since 1990. Even so, they remain the smallest emitters per person in this group at less than 2 tCO2.
The source for these Scope 1 emissions data is also BP’s Statistical Review of World Energy.
FOSSIL FUEL SUPPLY (SCOPE 3 EMISSIONS)
More Scope 3 transparency needed — The United Nations has a good system for collecting and reporting national Scope 1 emissions. But it lacks an equivalent for national Scope 3 emissions. As a result, it is significantly harder (see my notes below) to find and track what nations are doing with their Scope 3 climate pollution. The climate fight requires transparent and consistent emissions reporting to be successful. Everyone needs to be able to quickly and easily see what nations are doing with climate pollutants in order to monitor progress.
How I calculated Scope 3 emissions — For those interested in the nitty-gritty of how I calculated national Scope 3 emissions, here’s a quick overview:
[Top: Carbon-bombing the climate. Fossil fuel pollution is pumping an additional four atomic bombs worth of energy into our rapidly destabilizing climate system every second. Photo via U.S. National Archives]