Articles Menu
October 28th 2021
This is the second story in a series analyzing the federal emissions data from Canada's 100 heaviest emitters. The first story looks at the provinces and includes a map of where these facilities are.
If Canada wants to make a meaningful dent in its industrial carbon emissions, the data makes clear that the name of the game is fossil fuels.
Of Canada’s 100 heaviest emitters, the oil and gas industry sits at the top — both by raw emission output and the number of facilities based on 2019 data, the most recent available.
In Fort McMurray, Alta., Syncrude — a joint venture between Suncor Energy, Imperial Oil, Sinopec Oil Sands Partnership, and the China National Offshore Oil Corporation — is the largest emitter on the list, responsible for a little over 12,000 kilotonnes of CO2 equivalent greenhouse gases (GHGs), or about six per cent of the top 100’s total.
In 2019, the Alberta Energy Regulator gave Syncrude the green light for its $3.3-billion expansion plan to add two new mine sites. Suncor is the majority shareholder of Syncrude, having upped its ownership stake from 12 per cent to nearly 60 per cent since 2016.
Ottawa’s industrial classification system to track emissions carves the oil and gas industry into a number of subcategories, including refineries, pipelines, mined oilsands extraction, in situ oilsands extraction, and oil and gas extraction outside of the oilsands.
Mining refers to taking the ore from the ground and separating the bitumen in a processing plant, whereas in situ involves injecting steam underground to bring the oil to the surface. Mining creates tailings ponds, in situ does not, and because in situ involves less visible immediate damage to the landscape, it was previously touted by industry as being environmentally friendlier. In situ growth is also where the industry expects to increasingly turn over the coming decades, but emissions from in situ are generally higher due to the amount of energy required, upending claims it is a cleaner option.
There are 22 facilities involved in fossil fuel extraction, 13 refineries, and four pipelines on the top 100 list (although the TransCanada pipeline network is represented three times with facilities in Alberta, Saskatchewan, and Ontario). Collectively, this oil and gas constellation spat 94.7 megatonnes (MT) of GHGs into the atmosphere in 2019, representing about 48 per cent of the total emissions from the top 100 sites.
These emissions are from the facilities’ Scope 1 and 2 emissions, referring to emissions from its own operations, rather than taking into account the Scope 3 emissions from when the product is ultimately burned, like from a vehicle’s tailpipe. If Ottawa can adopt a strong clean fuel standard, it would go a long way to addressing those Scope 3 emissions.
The oil and gas emissions are also likely undercounted, due to how Canada estimates emissions compared to internationally recommended methods. A 2019 study estimated 30 per cent higher overall GHG emissions than what was reported by industry.
Of the reported emissions, oil and gas extraction was responsible for 71.1 MT of GHGs, refineries pumped out 16.9 MT, and pipelines recorded 6.6 MT in the top 100 list.
Analysis: If Canada wants to make a meaningful dent in its industrial carbon emissions, the data makes clear that the name of the game is fossil fuels. #cdnpoli - Twitter
The Irving Oil refinery in Saint John, N.B., was the heaviest-emitting refinery on the list. It is also the country’s largest, with a refining capacity of 320,000 barrels per day to produce a range of products like gasoline, marine fuel, furnace oil, and others. TC Energy’s TransCanada pipeline and Enbridge’s natural gas transmission line that cuts through British Columbia made the top 100 as well.
Many refineries could convert to cleaner fuels, like the Come by Chance Refinery in Newfoundland and Labrador (ranked 37 in the top 100), which this year announced new owners with plans to convert the refinery to produce biofuels. But pivoting to a new business model isn’t in the cards for every large emitter.
In the following table, you can see the emissions data from the top 100 sites based on their industrial classification and sorted by province.
Clean Energy Canada policy director Sarah Petrevan said there’s no credible pathway to net-zero by 2050 that allows for oil and gas production to still exist, meaning it has to be ramped down over time. But other heavy industries, like cement or steel making, are the foundations on which the economy is built, making the industries critical beyond 2050, she said.
One significant way to curb emissions in those sectors is to increase the availability of cleanly generated electricity. Heavy industry uses a tremendous amount of power, and if the only available energy source is a power grid dependent on fossil fuels, that will continue to be a problem for any decarbonization effort.
“Clean electricity, in the future, becomes a fuel source for those industrial processes,” Petrevan said.
Of the 100 heaviest-emitting sites, 26 of them are coal-, oil-, or gas-fired power plants that collectively emitted roughly 58.4 MT of GHGs, or about 30 per cent of the total emissions on the list.
Ten of those power plants are in Alberta, including the Genesee thermal generating station, a 1,300-megawatt (MW) coal-fired plant owned by Edmonton-based energy giant Capital Power — the country’s most polluting — responsible for 8,800 kilotonnes of GHGs. To put 1,300 MW in context, that’s larger than British Columbia’s Site C dam, which is planned to generate 1,100 MW.
Seven of the power plants are in Saskatchewan, five are in Nova Scotia, two are in Ontario, and New Brunswick and Newfoundland and Labrador each have one.
Because power grids in Canada do not always connect, flowing low-carbon energy from one area to another to displace fossil fuels is not always possible. Further, even when they do connect, the transmission capacity is not always sufficient. That implies a significant expansion is needed in order to fully decarbonize.
Oil is also used as a feedstock in petrochemical manufacturing, like at NOVA Chemicals’ Joffre and Corunna sites, which both made the top 100 list. Joffre is just east of Red Deer, Alta., while Corunna is in the Sarnia area of Ontario. Those sites produce billions of pounds of plastic annually. Dow Chemical’s Fort Saskatchewan facility also made the list. Those three petrochemical sites were the only ones to make the top 100 and together were responsible for roughly 5.5 MT in 2019.
Other heavy industries are also represented on the list. Ten cement plants spat out 8.9 MT of greenhouse gases, five steel mills added another (14.2 MT), and four aluminum plants contributed (3.3 MT). Two iron mines pumped out roughly 1.8 MT.
These heavy industries are critical to building the types of infrastructure and communities people depend on as the climate breakdown worsens. They are also among the most difficult to decarbonize. Efforts are underway, but it will be more difficult to bring the emissions down in these industries relative to other sectors on the list.
“It's hard to reduce emissions in cement and steel, because … the chemical reaction in making cement and steel releases CO2,” said Isabelle Turcotte with the Pembina Institute.
“So, for me, that's a story of a circular economy, because we have to consume differently, and have to think about our cities and our buildings in a way where we're emitting less.”
Chemical fertilizer manufacturers also made the list. There were five facilities classified as “chemical fertilizer manufacturing” (except potash) that were responsible for 3.9 MT, and two potash mining facilities responsible for 1.3 MT.
Teck Resources’ Fording River operations in Elkford, B.C., was the sole bituminous coal-mining site in the top 100 in 2019. It produces metallurgical coal (separate from thermal coal used for electricity generation) that is used in steel making. Its emissions were 689 KT (0.69 MT), and have been climbing.
— Data visualization from Nora Legrand
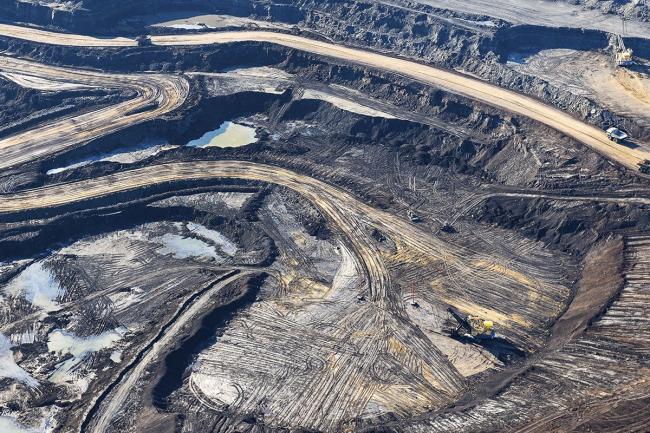
[Top photo: Aerial photo of the Athabasca oilsands in Alberta. Photo by Andy S. Wright]