Articles Menu
Mar. 16, 2023
ProPublica is a nonprofit newsroom that investigates abuses of power. Sign up to receive our biggest stories as soon as they’re published.
In 2013, the worst Ebola outbreak in history started in a small village in southern Guinea, eventually tearing through West Africa. By the time it ended in 2016, more than 11,300 people were dead. Scientists have linked this and other Ebola outbreaks to specific patterns of deforestation.
To understand why, ProPublica adapted an academic model to show how the way forests are being cut down around the locations of multiple previous outbreaks could increase the risk of another outbreak today.
[To properly follow this article you will need to go to full article with graphics and videos at link here: https://projects.propublica.org/spillover/ ]
The West Africa outbreak is believed to have started in Meliandou, a village in southern Guinea nestled within a ring of lush forest. The residents of Meliandou have been clearing patches of forest over the years, creating land for farming and cutting down trees to burn wood for charcoal.
Between 2000 and 2013, the year of the outbreak, the forest around Meliandou and the neighboring city of Guéckédou was pocked with hundreds of clearings. In total, the clearings added up to only about 6% of the total area within 20 kilometers, or about 12.5 miles, of the village.
But each of these patches creates “mixing zones” around them where wild animals and humans are more likely to come into contact with one another. Over the same period of time, the total mixing zone grew, soaring from less than 10% of the area around Meliandou and Guéckédou to swallow up the entire area.
Why does a relatively small amount of forest loss result in such a drastic increase in mixing zone area?
It’s all about edges.
Consider a circular area of forest with a 20 kilometer radius in a region where deforestation is tightly controlled. As a result, there has only been intense deforestation in one contiguous area.
The model assumes that humans are likely to spend most of their time in deforested areas, and forest-dwelling wild animals tend to stay in their habitats. But it’s along the edges of the remaining forest where they are likely to interact. In this scenario, the regions where animals and humans meet are in the border of the one neatly deforested area.
However, if the same amount of forest is cut down haphazardly in many smaller individual patches...
...the total area covered by these mixing zones grows rapidly relative to the amount of forest that’s been lost.
Eventually the mixing zone dominates the entire area.
The implications of such a drastic increase in mixing zone area over a relatively small increase in deforestation are serious. In 2018, a team led by Christina Faust, a researcher at the University of Glasgow, Scotland, developed a peer-reviewed model that directly links changes in forest cover to the potential for spillover events. To understand how the potential for spillover had changed since the 2013 outbreak, we applied data from real-world satellite images to this theoretical model.
We started by looking at how much forest was lost in 2001, the first year available in satellite data compiled by the University of Maryland and Global Forest Watch.
Then we tracked the relative size of the mixing zones, or edges, over time to see how patchy the deforestation had become around Meliandou.
The trend line over 20 years of data looks like an arch. As patchy deforestation picks up, the total amount of edge also increases. Finally, when so many trees are cut down that patches merge, the larger clearings mean there is less edge and the curve goes down.
When we plug this data into the model, it shows how large amounts of edge can push up the risk of a spillover happening. The result? The risk of spillover has increased since the outbreak in 2013.
It’s not just Meliandou where the model shows spillover risk has increased because of deforestation. We analyzed satellite-image data for six other locations in the Democratic Republic of Congo and Uganda, where previous Ebola outbreaks have been linked to forest loss. In four of them, deforestation since the previous outbreak follows a similar, worrisome pattern that increases the risk of spillover in these locations, according to our analysis.
Deforestation is just one pathway that can lead to spillover, but it’s a key driver that’s largely ignored by governments and international health agencies. Reducing risky deforestation to minimize spillover opportunities will require policymakers to work closely with communities that need to clear forests for their livelihoods.
Disease ecologist Barbara Han, who was not involved in the model, said our analysis helps highlight the consequences if deforestation is not addressed. While policymakers typically prioritize more immediate health issues, Han said, this type of analysis can focus attention on preventing “even more health risks down the line that are more explosive and harder to control.”
Video illustration by Kathleen Flynn and Anna Donlan.
Sources: Hansen/UMD/Google/USGS/NASA, Google, OpenStreetMap. Spillover model via Faust, et. al. 2018. Read our full methodology.
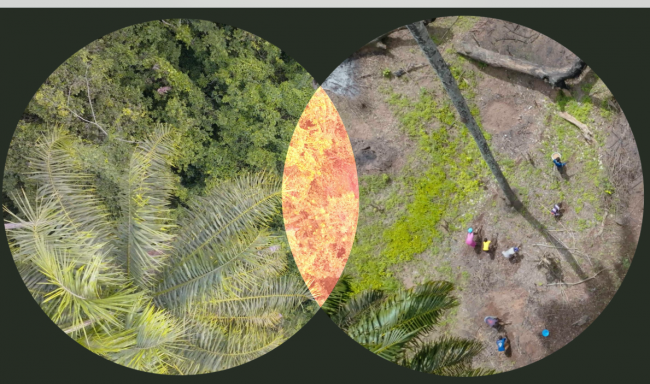
[Top photo - still from video: The next pandemic could emerge from the edges around these patches, where wildlife and humans mix.]