Articles Menu
Oct. 18, 2023
Methane is becoming a serious threat to humanity, and Canada’s oil and gas industry is emitting a huge amount of it.

Methane is a short-lived greenhouse gas that disappears within a decade or two. Unfortunately, it is extremely powerful while it exists — 82.5 times more potent than CO2 during the first couple of decades after its release.
This planetary superheater has caused roughly a third of global heating so far. And atmospheric levels of it are at record highs and surging higher.
Canada is a major emitter of methane — both in total emissions and emissions per capita.
Our single largest source is “fugitive emissions” from the oil and gas industry. That’s a fancy term for leaks.
According to Canada’s official National Inventory Report (NIR), these oil and gas industry leaks emit roughly half our national methane total. But the actual amount the industry is leaking is likely much larger.
Recent studies using satellites reveal most nations, including Canada, have been significantly underreporting methane leaks from their oil and gas industries.
The most recent, "National quantifications of methane emissions from fuel exploitation using high-resolution inversions of satellite observations" published this summer in Nature Communications, covers methane emissions in the year 2019.
Globally, it found the oil and gas industry was leaking 30 per cent more methane than governments were reporting. In Canada, unreported leakage was even higher.
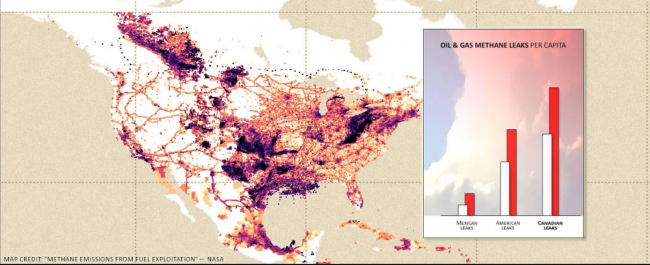
My next chart illustrates the study’s findings for Canada and our two North American neighbours.

The white bars are what governments reported. Red bars show what the satellites actually detected.
In both Canada and the United States, methane leaks were roughly 50 per cent higher than reported. In Mexico, they were double.
This chart also lets you compare how much methane each nation is leaking per capita. As you can see, Canadians are leaking far more methane per person than even the frack-crazed Americans.
That’s because Canadians extract far more fossil oil and gas per capita than the Americans do. And far more than just about any other people on the planet as well.
For scale, Canada's methane leaks pack a 20-year climate punch equal to five tonnes of CO2 per Canadian. That's more than from our cars, trucks, SUVs and homes combined. Methane's short-and-fast heating acts like climate napalm in the first decade or two.
The world's #Methane #emissions are underreported and overwhelming, satellite monitoring shows. #Canada is an outsized culprit when it comes to this dangerous greenhouse gas. @bsaxifrage writes for @NatObserver - Twitter
And these next few decades are critical in our climate fight, as surging global temperatures are threatening to push major ecosystems beyond dangerous climate tipping points.
How do our methane leaks compare to the emissions from other parts of our economy and lives? My next chart puts them in context. It shows the 20-year global warming potential of emissions from several familiar Canadian sources.

The tall red bar is the methane leaks detected by satellites. It’s equal to 182 million tonnes of CO2 (MtCO2e).
The grey bars show all other greenhouse gas emissions — including methane emitted in the other sectors.
As you can see, the oil and gas industry leaks are overwhelmingly huge. They tower above the climate pollution from Canadian homes, cars, electricity, and all our other industries.
And leaks are not the only climate damage caused by the oil and gas industry. As the chart shows, the industry also emits huge amounts of CO2 and other climate pollutants (the grey bar on top). The industry total is well above 300 MtCO2e. That’s a huge climate-hammering over the next couple of decades, even by Canada’s super-emitter standards.
Unfortunately, humanity has delayed climate action for so long that we need to switch to triage mode to stave off a full-blown climate crisis.

At this point, eliminating methane emissions from the oil and gas industry just isn’t enough. We now must reduce all major sources of methane to get to “net zero” for methane, too.
In Canada, most of the rest of our methane emissions come out of cows — either one end or the other.
I've highlighted the methane emissions from agricultural animals in yellow on this version of the chart.
The majority comes from cow burps. Emissions from microbes digesting animal manure make up most of the rest.
While agriculture’s methane total is only half as much as oil and gas leakage, it has far too large a climate impact to ignore this point in the climate crisis.
Most of the time, the climate crisis conversation focuses on the long-term impacts of emissions. For example, Canada and most other nations report the 100-year global warming impact of emissions. That’s an important view because it focuses on the immorally massive, long-term harm we are inflicting on future generations.
In this article, however, I choose to focus on the 20-year impacts of our emissions. This is also an important view because it highlights what we are unleashing in the next few decades. This shorter focus is especially relevant when talking about the damage methane causes.
Fortunately for our collective survival, the super-heating power of methane emissions only lasts for about a decade, before methane turns into CO2. If methane persisted for centuries, like CO2 does, it would cook everything. Methane’s short-but-hot lifespan means it is most damaging in the short term.
The second reason I focused on the short-term is because the next few decades are critical in the climate fight. Global greenhouse gas levels are at a record high and surging higher. And now global temperatures have started surging as well. Many climate scientists are growing concerned that global heating has started to accelerate. We are in danger of quickly blowing past climate guardrails and pushing several major ecosystems beyond their tipping points.
Some of those tipping points include flipping major ecosystems from historical CO2 absorbers (which slowed climate change) into future CO2 emitters (which will turbocharge climate change). We’ve already flipped Canada's managed forest into a growing carbon emitter. Now the vast Amazon rainforest is dangerously close. These tipping points aren’t limited to forests. A new study in Nature warns rapid temperature spikes can unleash “irreversible loss in marine ecosystem habitability” — even if temperatures fall back down later.
So, it is no surprise that international pressure is growing to accurately measure the oil and gas industry’s massive methane leaks — and to shut them down ASAP.
Even fossil oil boosters over at the International Energy Agency (IEA) are worried. They just released a report titled “The Imperative of Cutting Methane from Fossil Fuels.” They warn “targeted actions to tackle methane emissions from fossil fuel production and use are essential to limit the risk of crossing irreversible climate tipping points.” They call for “rapid cuts in methane emissions from fossil fuels” and emphasize the vast majority of methane leaks can be stopped using “existing technology, often at low cost.”
Shutting down oil and gas industry methane leaks is a no-regrets climate survival strategy.
We know how to do it.
We could have done it years ago.
But we didn’t.
Now, time is running out for us. As the climate storm breaks with increasing fury, we’d be crazy to let this one industry’s leaks continue hammering away at our collective future.
-------------------
ENDNOTES
For those readers wanting to know more about the nitty-gritty of calculating the relative global warming potentials of greenhouse gases over different time frames, here’s an extended discussion.
The relative climate impact of greenhouse gases changes over time. That’s because some, like methane, are super-heaters but only last for a few years — while others, like CO2, are slower heaters that persist for centuries.
To compare different greenhouse gases, climate scientists calculate the global warming potentials of each:
Yeah, the "first" 500 years! As the World Meteorological Organization (WMO) states: “The accumulation of CO2 in the atmosphere is irreversible on human timescales and will affect climate for millennia.” Sorry, all future children.
The GWP values for all the greenhouse gases are listed in the International Panel of Climate Change’s Sixth Assessment Report (see Table 7.15).
Here is methane’s:
In this article and charts, I used the GWP-20 values for methane and for the other greenhouse gases. As mentioned above, I did this to emphasize the short-term impacts they will cause.
Canada, like most nations, uses GWP-100 values for its official national inventory report (NIR). This emphasizes the longer-term impacts we are passing along to future generations. So, the CO2-equivalent values listed in Canada’s NIR will be different from what I’ve shown on the charts in this article. That’s because, again, this article focuses on impacts over the next two decades while the NIR focuses on the impacts over the next century.
For those data nerds out there who want to calculate Canadian emissions using other GWP time frames, here’s what I did: